Combining the Cursor and Copilot APIs
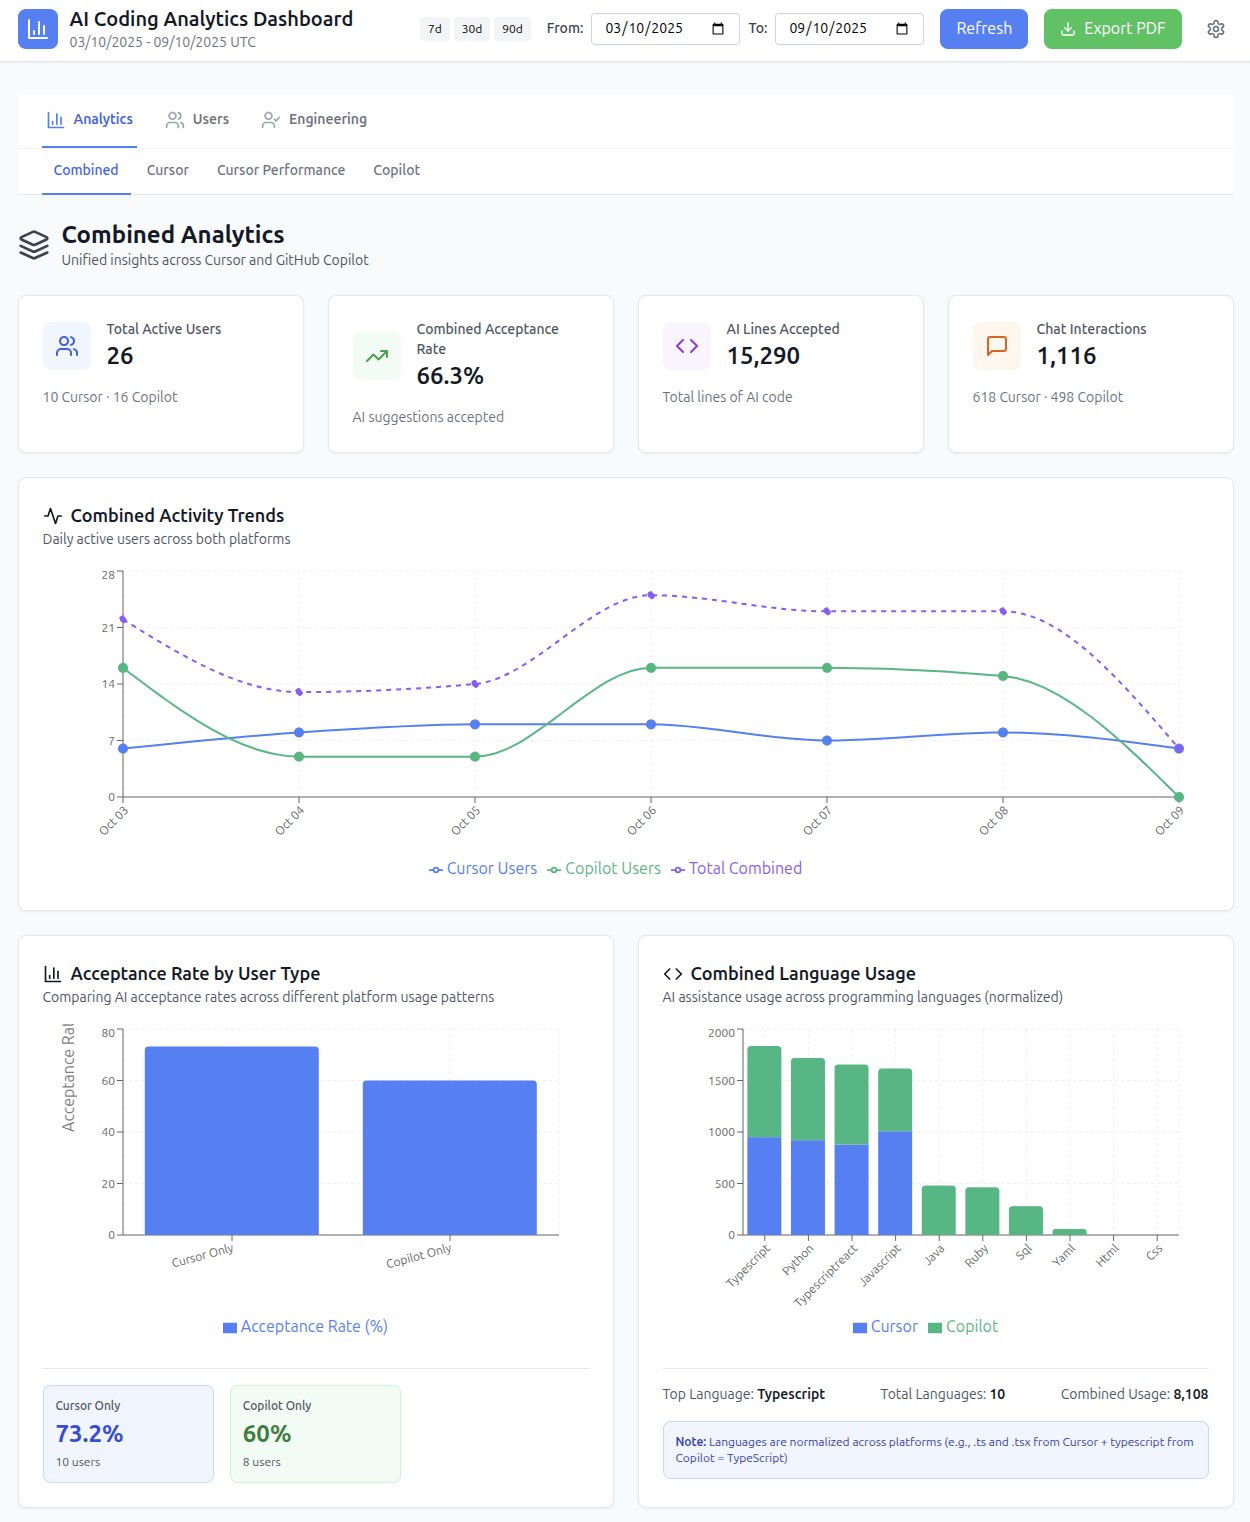
I built a dashboard pulling usage data from the Cursor admin API and the GitHub Copilot API into a single view.
Two APIs, different shapes Link to heading
The problem is that Cursor and Copilot expose fundamentally different data.
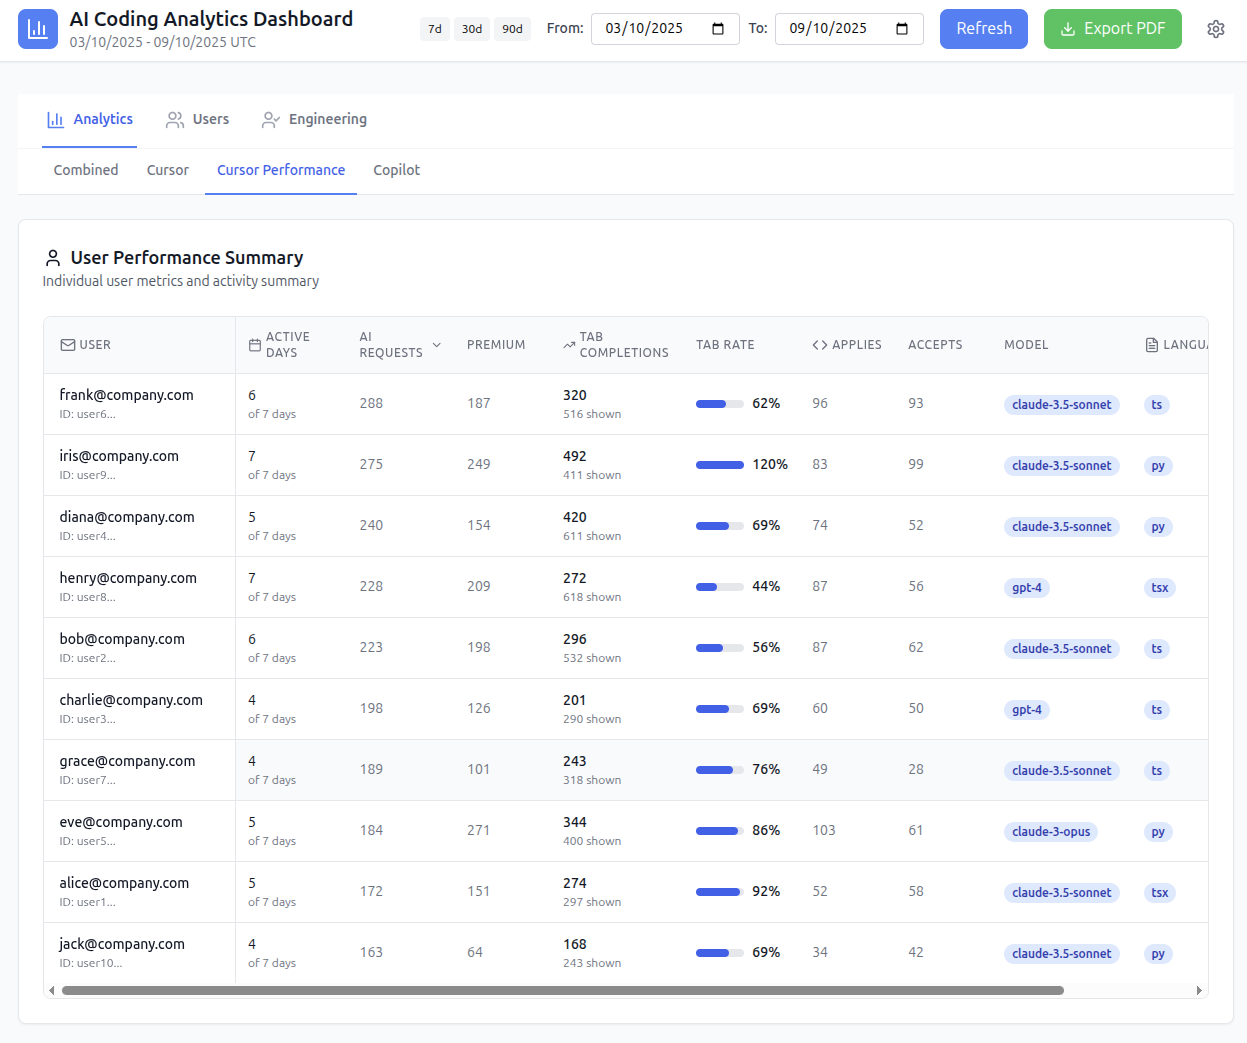
Cursor’s admin API returns per-user, per-day rows. Each row is one engineer on one day: tab completions shown and accepted, chat requests, AI models used, file extensions worked in. Granular enough to calculate per-engineer acceptance rates and identify who is and is not actively engaged. The sample responses below are illustrative, generated for this post rather than taken from real usage.
{
  "userId": "user1",
  "email": "alice@company.com",
  "day": "2025-10-06",
  "isActive": true,
  "totalTabsShown": 142,
  "totalTabsAccepted": 118,
  "chatRequests": 23,
  "composerRequests": 31,
  "agentRequests": 8,
  "acceptedLinesAdded": 287,
  "tabMostUsedExtension": "tsx"
}
Copilot’s API returns org-level aggregates: total suggestions, total acceptances, active users, language breakdowns. There is no per-user breakdown. The seats endpoint tells you who has a licence, not how much each person uses it.
{
  "date": "2025-10-06",
  "total_active_users": 14,
  "total_engaged_users": 11,
  "copilot_ide_code_completions": {
    "total_engaged_users": 11,
    "languages": [
      {
        "name": "typescript",
        "total_code_suggestions": 847,
        "total_code_acceptances": 312
      }
    ]
  }
}
This is why a per-engineer view is possible for Cursor but not for Copilot. It is a limitation of what the API exposes, not the dashboard.
The data providers do not expose Link to heading
The asymmetry between the two APIs points at a broader gap. Cursor’s per-user granularity makes it possible to ask meaningful questions: which engineers are actively engaged, which are not, what features they reach for. Copilot’s aggregate-only data makes most of those questions unanswerable.
The point of that granularity is not oversight. Low engagement is a prompt to ask what would make the tools more useful, not a performance concern, and that is not a conversation you can have from an aggregate.
This is not a technical limitation. GitHub knows who is and is not using Copilot: the seats endpoint proves it.
The per-user data exists; it is just not exposed.
Organisations trying to understand whether their investment is working at the individual level are blocked not by complexity but by what the API chooses to surface.
The case for a common standard Link to heading
Cursor reports file activity by extension (.ts, .tsx, .py). Copilot reports by language name (TypeScript, Python). A normalisation layer in the dashboard maps both to a common vocabulary: a .tsx file from Cursor and typescriptreact from Copilot appear as the same language in the charts.
The discrepancy is a small symptom of a larger problem.
There is no common vocabulary for AI coding tool usage data.
Each provider defines its own metrics, field names, and granularity. Cross-platform analysis requires building the translation layer yourself. As teams run multiple AI tools in parallel, a shared standard for telemetry, even a minimal one covering suggestions, acceptances, and active users per language, would make that analysis straightforward rather than bespoke.