There is a gap between “the team has AI tools” and “the team uses AI tools well”. Filling that gap requires data. Most organisations reach for one metric in particular: lines of code written or committed by AI. It is not the right metric.
I previously built a dashboard pulling usage data from the Cursor admin API and the GitHub Copilot API into a single view. I also built a tool to extract AI commit lines broken down by Bitbucket project. It answers the question that usually gets asked. It does not answer the question I actually care about. What both tools showed, and what they could not show, is what shaped how I think about measuring AI adoption now.
The variance is the first thing you notice Link to heading
The first thing this kind of data tends to reveal is variance. Daily engagement is usually lower than the licence count implies, and the spread across a team is wide. At one end sit high interaction counts, consistent daily usage, and clear patterns in which features get reached for. At the other, the tool is provisioned and barely touched.
This is easy to miss without data. In a standup or a retro, the people who have adopted AI well will talk about it. The ones who have not will not flag it. The vocal signal skews positive.
The engineers who use AI well will talk about it. Those who do not, will not.
Acceptance rate needs careful interpretation Link to heading
Acceptance rate is the metric that looks most informative and requires the most care. A high rate could mean suggestions are well-targeted and the engineer is right to trust them. It could mean the engineer is accepting suggestions without enough critical review. A low rate could mean the tool is not helping much, or it could mean the engineer is working in a domain where AI suggestions are less reliable and they know it.
What acceptance rate tells you, in combination with interaction volume, is engagement pattern. High volume and high acceptance: probably using tab completions for mechanical work. High volume and low acceptance: probably using chat to work through a problem, rejecting most suggestions but finding the process useful. Both are legitimate. They look different in the data.
Feature usage is a more interesting signal Link to heading
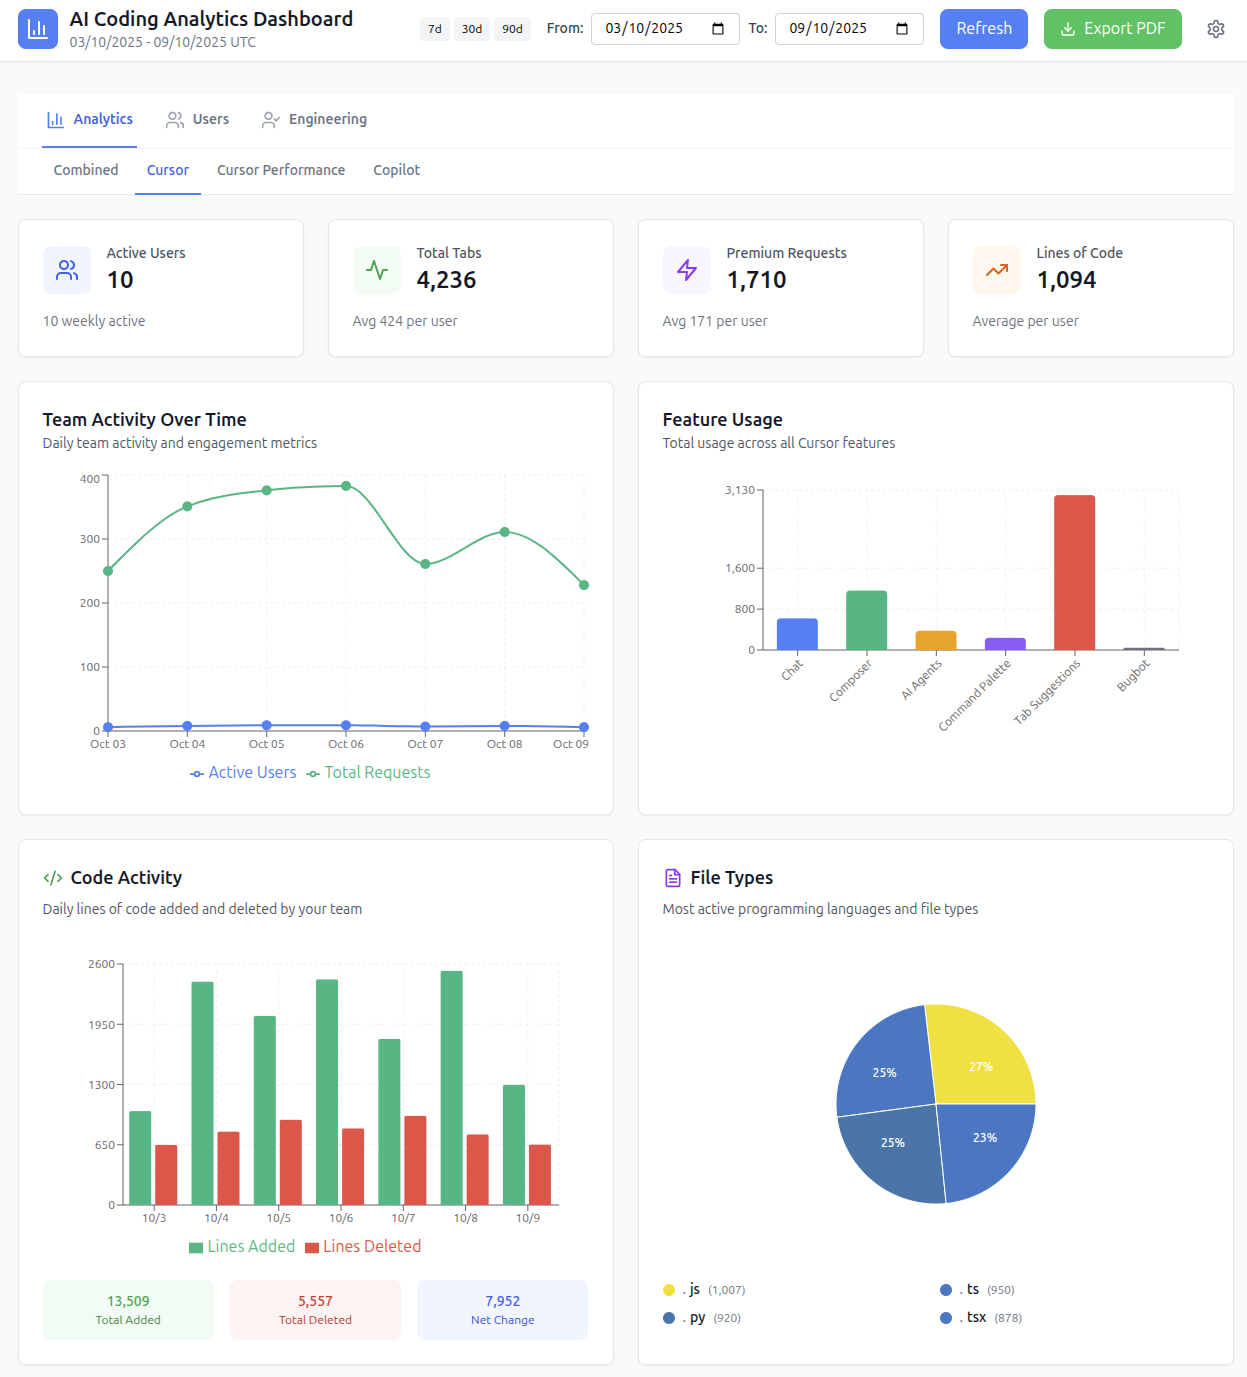
The breakdown between tab completions, chat, and agent features tells you more than aggregate counts. An engineer who only uses tab completions is getting value at the lowest level of integration. One who uses chat heavily is using it as a thinking partner. One who reaches for agent features is delegating larger pieces of work.
This maps onto a distinction I find useful: using AI to reduce mechanical overhead versus using it for work that requires judgement. Feature usage is not a perfect proxy for that, but it is a visible signal.
Which features an engineer reaches for says more about how they use AI than how much they use it.
What the data cannot tell you Link to heading
The obvious limitation is quality. You can measure how much an engineer accepts AI suggestions. You cannot measure whether the accepted code is good. High acceptance of poor suggestions is worse than low acceptance of good ones.
This is the reason the data should inform conversations, not replace them. Low engagement is a prompt to ask what would make the tools more useful, not a performance concern. The answer sometimes reveals real reasons: a domain where AI assistance is less reliable, a workflow where the tool does not integrate well, or simply not having found the patterns that make it click for them.
The harder question Link to heading
The problem is that it misleads in both directions: low counts do not mean the tools are not helping, and high counts may be a signal of poor use rather than good. An engineer accepting large AI-generated blocks without critical review will produce a high number. So will one doing careful, high-leverage work. The metric does not distinguish them.
The harder question is how you measure good use of AI rather than just use. I have not found a satisfying answer to that.
What I think is probably true:
If AI tooling is improving how a team works, it should eventually show up in the metrics you were already tracking.
Sprint velocity. Cycle time. Bug rate reaching production. Time from idea to value delivered. These are imperfect measures with many confounding variables, but they measure outcomes rather than activity.
The usage data is upstream of that signal. It tells you whether engineers are building the habits. It does not tell you whether those habits are producing better outcomes. For that, you have to look at the metrics that measure what you actually care about, and wait.